ESQUERDA - Configuração experimental. O experimento foi realizado em uma configuração caseira, que combinou microscopia de ressonância magnética detectada opticamente (ODMR) com microscopia de força atômica (AFM). DM:espelho dicróico. BP:filtro passa-banda trabalhando em 650-775 nm. APD:fotodiodo de avalanche. CCD:dispositivo acoplado de carga. LED:diodo emissor de luz de 470 nm. AL:lente acromática. PH:furo de alfinete com tamanho de 30 μm. BS:divisor de feixe. À DIREITA - Imagens dos nanopilares em diamantes. (A) Imagem de SEM dos nanopilares de diamante fabricados logo após a corrosão iônica reativa (RIE). O topo do nanopilar é coberto pelo hidrogênio silsesquioxano (HSQ) para proteger o centro NV. (B) Um único nanopilar em forma de cilindro trapezoidal para detectar seções de células aderidas à ponta de AFM. Barras de escala, 10 μm (A); 400 nm (B). Crédito:Science Advances, doi:10.1126 / sciadv.aau8038.
Nas ciências da vida, a capacidade de medir a distribuição de biomoléculas dentro de uma célula in situ é um objetivo investigativo importante. Entre uma variedade de técnicas, os cientistas usaram a imagem magnética (MI) com base no centro de vacância de nitrogênio (NV) em diamantes como uma ferramenta poderosa na pesquisa biomolecular. Contudo, a imagem em nanoescala de proteínas intracelulares tem permanecido um desafio até agora. Em um estudo recente agora publicado em Avanços da Ciência , Pengfei Wang e colegas dos departamentos interdisciplinares de física, biomacromoléculas, informação quântica e ciências da vida na China, usaram proteínas de ferritina para demonstrar a realização MI de proteínas endógenas em uma única célula, usando o centro de vacância de nitrogênio (NV) como o sensor. Eles capturaram imagens de ferritinas intracelulares e organelas contendo ferritina usando MI e microscopia eletrônica correlativa para preparar o caminho para imagens magnéticas em nanoescala (MI) de proteínas intracelulares.
O aumento da resolução espacial existente de imagens biomédicas é necessário para atender às demandas contínuas em imagens médicas, e portanto, entre uma variedade de técnicas, a imagem magnética é de amplo interesse no momento. A ressonância magnética (MRI) é amplamente usada para quantificar a distribuição de spins nucleares, mas a MRI convencional só pode atingir uma resolução de 1 µm em imagens de spin nuclear onde a resolução é limitada pela sensibilidade de detecção elétrica. Os cientistas desenvolveram uma série de técnicas para quebrar essa barreira de resolução, incluindo um dispositivo supercondutor de interferência quântica e microscopia de força de ressonância magnética. No entanto, esses relatórios requerem um ambiente criogênico e alto vácuo para geração de imagens, limitar a implementação experimental e sua tradução para a prática clínica.
Um método de sensoriamento quântico desenvolvido recentemente com base no centro de vacância de nitrogênio no diamante empurrou radicalmente os limites das técnicas de MI em nanoescala para detectar moléculas orgânicas e proteínas em laboratório. Os cientistas combinaram a detecção quântica com centros NV e microscopia de sonda de varredura para demonstrar ressonância magnética em nanoescala para spin único de elétron e conjunto de spin nuclear pequeno, enquanto usam o centro NV como um magnetômetro biocompatível para imagens não invasivas de partículas ferromagnéticas dentro das células na escala subcelular (0,4 µm). Por exemplo, a despolarização do centro NV pode ser usada como um magnetômetro de banda larga para detectar e medir o ruído flutuante de íons metálicos e spins nucleares. Contudo, tal imagem de proteínas únicas via MI em nanoescala não foi relatada na célula única até agora.

Esquema da configuração e princípio experimental. (A) Visão esquemática da configuração experimental. A célula incorporada em resina é anexada a um diapasão e faz a varredura acima do nanopilar de diamante que contém um centro NV raso. Um fio de cobre é usado para fornecer o pulso de micro-ondas ao centro NV. Um laser verde (532 nm) do microscópio confocal (CFM) é usado para abordar, inicializar, e leia o centro NV. (B) Esquerda:Rede cristalina e nível de energia do centro NV. O centro NV é um defeito pontual que consiste em um átomo de nitrogênio substitucional e um vazio adjacente em diamante. À direita:vista esquemática de uma ferritina. As setas pretas indicam os spins do elétron de Fe3 +. (C) Demonstração experimental da detecção de ruído de spin com e sem ferritina na forma de decaimento de polarização para o mesmo centro NV. A inserção é a sequência de pulso para detecção e imagem da ferritina. Um laser verde de 5 μs é usado para inicializar o estado de rotação para ms =0, seguido por um tempo de evolução livre τ para acumular o ruído magnético, e, finalmente, o estado de spin é lido detectando a intensidade da fluorescência. A sequência de pulso é repetida cerca de 105 vezes para adquirir uma boa relação sinal-ruído (SNR). O tempo de relaxamento é ajustado para 0,1 e 3,3 ms por decaimento exponencial para o caso com e sem ferritina, respectivamente, indicando um ruído de rotação de 0,01 mT2. Crédito:Science Advances, doi:10.1126 / sciadv.aau8038.
No presente trabalho, Wang et al. relataram dois avanços técnicos para permitir MI em nanoescala de proteínas intracelulares dentro de uma única célula. Por esta, eles congelaram a célula em um estado sólido e a segmentaram intrincadamente em uma forma de cubo, em seguida, colocou-o em uma sonda de varredura diapasão de um microscópio de força atômica (AFM) para imagens, onde a seção transversal plana da célula foi exposta ao ar. Os cientistas usaram a configuração de colocação de amostra para permitir que o sensor NV seja posicionado dentro de 10 nm das proteínas alvo e usaram o AFM para suprimir a deriva térmica durante o posicionamento da amostra. Eles, então, projetaram nanopilares trapezoidais em forma de cilindro em uma superfície de diamante para aquisição de imagem, encurtando tecnicamente o tempo de aquisição da imagem em uma ordem em comparação com os métodos anteriores. No presente estudo, os cientistas usaram essa técnica para conduzir MI in situ do ruído flutuante magnético das proteínas de ferritina intracelular (um biomarcador de estoques de ferro e saturação de transferrina no corpo) dentro da configuração experimental.
A ferritina é um complexo de proteína globular com diâmetro externo de 12 nm, contendo uma cavidade medindo 8 nm de diâmetro que permite que até 4.500 átomos de ferro sejam armazenados dentro da proteína. O ruído magnético dos íons férricos pode ser detectado devido aos seus efeitos no T 1 tempo de relaxamento de um centro NV. Nesse trabalho, Wang et al. confirmou a observação usando medições de fluorescência de decaimento dependente do tempo da população de centros NV (spin magnético, m S =0 estado), em uma superfície de diamante revestida com ferritinas. Adicionalmente, os cientistas detectaram o ruído magnético com métodos sem etiqueta usando o centro NV via microscopia eletrônica de transmissão (TEM). The work allowed the development of a correlated MI and TEM scheme to obtain and verify the first nanoscale MI of a protein in situ.
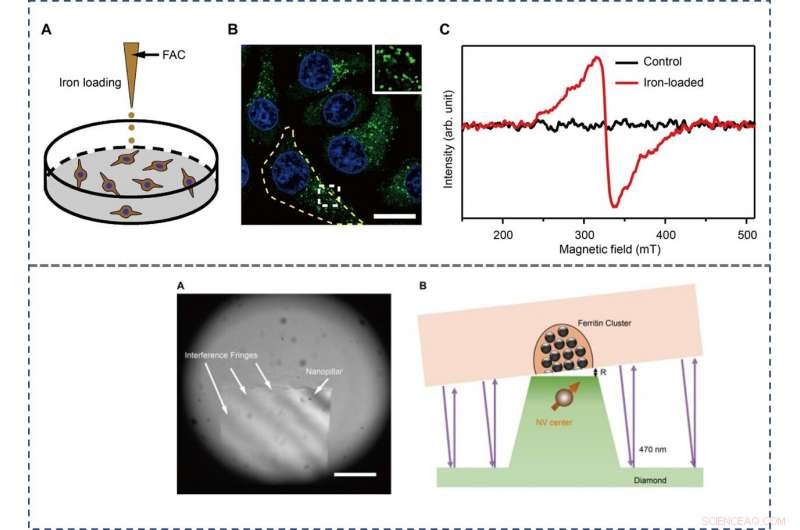
The scientists used the hepatic carcinoma cell line (HepG2) for the experiments and studied iron metabolism by treating the cells with ferric ammonium citrate (FAC), which significantly increased the amount of intracellular ferritin. They verified this using confocal microscopy (CFM), western blotting and TEM techniques at first. The results showed the primary localization of ferritins in the intracellular puncta around the nucleus, among the cytoplasm. The scientists used bulk electron paramagnetic resonance (EPR) spectroscopy to confirm the paramagnetic properties of ferritin in the FAC-treated HepG2 cells and mass spectroscopy to measure the interference due to other paramagnetic metal ions.

TOP - The preparation and characterization of ferritin-rich HepG2 cell samples. (A) Schematic view of the treatment to cultured cells. Following iron loading or no treatment, the HepG2 cells were examined for fluorescence images and EPR spectra, respectivamente. For the MI and TEM imaging, cell samples were treated through high-pressure freezing, freeze substitution, and sectioning. (B) Representative confocal microscopy (CFM) image of ferritin structures (green) in iron-loaded HepG2 cells. The ferritin proteins were immunostained by anti-ferritin light chain antibody. The nuclei are indicated by 4′, 6-diamidino-2-phenylindole (DAPI) in the blue channel. Inset displays magnified ferritin structures. The yellow dashed line outlines the contour of a cell. Barra de escala, 20 μm. (C) EPR spectra of control and iron-loaded HepG2 cells at T =300 K. BOTTOM - Adjusting the distance between the NV center and the cell section. (A) Interference fringes between the cell cube and the diamond surface. Barra de escala, 20 μm. (B) The geometric relation and the gap R between cell samples and diamond-pillars for MI. The top surface diameter of the nanopillar is 400 nm. Credit:Science Advances, doi:10.1126/sciadv.aau8038.
Wang et al. then used ultrafast, high-pressure freezing to immobilize all intracellular components of the Fe-loaded cells. The process stabilized the intracellular structures and molecules by minimizing Brownian motion in cells, which typically contributes to random motion of proteins up to 100 nm in vivo. To image the samples, they embedded and polymerized the frozen cells in LR White medium, followed by gluing the embedded cell sample to the AFM tuning fork with a few cells at the tip. Using a diamond knife, the scientists then sectioned the tip surface to nanometer flatness to examine the cuboid cell section under AFM. They acquired MI images of ferritins by scanning the cell cube along the diamond nanopillars and simultaneously measured NV spin repolarization rate using the "leapfrog" scanning mode of the microscope as detailed previously.

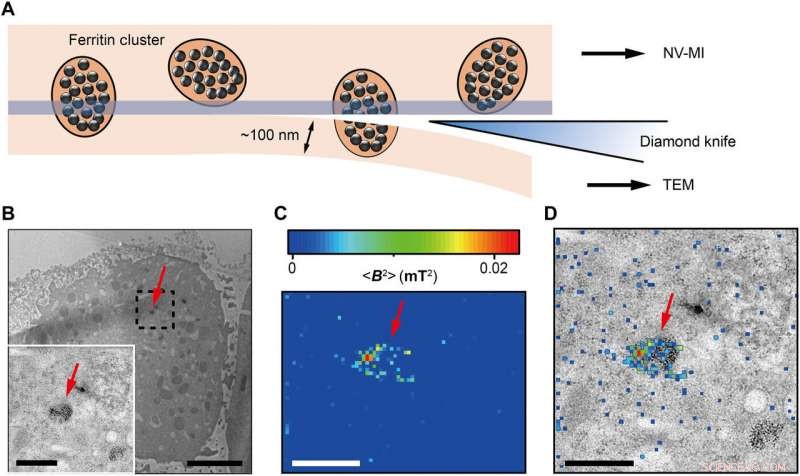
Correlative MI and TEM images. (A) Schematic view of sectioning for correlative MI and TEM imaging. The last section and the remaining cube were transferred for TEM imaging and MI scanning, respectivamente. The sectioning resulted in some split ferritin clusters that could be imaged under both microscopes. A transparent blue strip of ~10 nm indicates the imaging depth of the MI, while in the TEM, the imaging depth is ~100 nm. (B) Distribution of ferritins from the last ultrathin section under TEM. Inset:Magnified figure of the part in black dashed box. (C) MI result of the remaining cell cube. The pixel size is 43 nm. (D) The merged MI and TEM micrograph shows ferritins in a membrane-bound organelle. The red arrows in (B) to (D) indicate the same ferritin cluster. Scale bars, 5 μm (B) and 1 μm [B (inset), C, and D]. Credit:Science Advances, doi:10.1126/sciadv.aau8038.
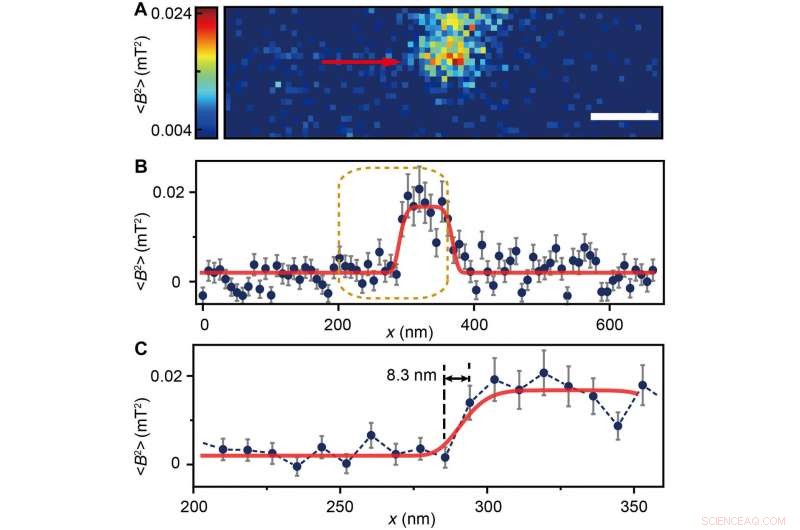
The scientists measured fluorescence decay at a fixed free evolution time of 50 microseconds (τ =50 μs) to reveal the degree of NV sensor spin polarization, which correlated with the amount of ferritin in the sensing volume. They observed the appearance of some clusters via both TEM and MI images, although some details were not observed in MI, the results confirmed that spin noise from intracellular ferritin contributed to depolarize the NV center. In order to obtain details of the ferritin clusters at higher resolution, the scientists minimized the pixel size to 8.3 nm and acquired MI of high resolution of the proteins as expected.
Desta maneira, Wang et al. explored the sensitivity of NV centers as an appropriate sensor for biological imaging applications at the level of the single molecule. They used the technique as a sensor in the experimental setup to obtain the first MI of a protein at a resolution of 10 nm in situ. The scientists aim to improve the stability and sensitivity of the technique to speed up the scanning process and image a larger area of interest in the cell and locate ferritin beyond the nucleus in association with additional organelles.

(A) Ferritin cluster imaged by the NV sensor with 80 × 24 pixels and a pixel size of 8.3 nm. Barra de escala, 100 nm. (B) Trace data of the scanning line in (A) directed by the red arrow. The platform indicates the ferritin cluster. The red curve fitted by a plateau function serves as a guide to the eye. (C) Magnified figure of the gold dashed box in (B). The sharp transition indicated by the red arrow around x =283 nm shows the scanning from the blank area to the area with ferritins. Credit:Science Advances, doi:10.1126/sciadv.aau8038.
The work will contribute to clinical diagnostics to determine biomarker-based iron storage and release in cells. This will include studies on the regulatory mechanisms of iron metabolism during the progression of hemochromatosis, anemia, liver cirrhosis and Alzheimer's disease. Wang et al. propose to extend the approach in situ to other cellular components with paramagnetic signals, including magnetic molecules, metalloproteins and special spin-labelled proteins. The scientists envision that further studies will explore additional targets suitable for high-resolution MI and correlated TEM imaging techniques, with optical microscopy detection incorporated to the experimental setup to extend the work and determine protein nuclear spin MRI as well as perform three-dimensional cell tomography.
© 2019 Science X Network